Updated on September 3, 2024
Disability is a significant aspect of Australia’s demography, affecting millions and influencing various aspects of life, from health and education to employment and social participation.
By examining recent statistics, we can understand the challenges faced by people with disabilities and the progress made toward inclusivity and support.
Defining Disability
The Australian Bureau of Statistics (ABS) defines disability as “any limitation, restriction, or impairment which restricts everyday activities and has lasted, or is likely to last, for six months or more.”
This broad definition encompasses many physical, sensory, intellectual, and mental/behavioural impairments that affect daily living.
Disability is increasingly understood as arising from the interaction between a person and their environment.
This environment includes physical barriers, digital accessibility limitations, and negative attitudes or communication issues and they impact a person’s ability to fully participate in society.
Disability Prevalence in Australia
Overview
Disability prevalence in Australia is a critical measure for understanding the scope and impact of disabilities on the population.
Recent data from the ABS provides a detailed picture:
- Around 1 in 6 (18%) Australians have a disability, approximately 4.4 million people [Source: ABS 2019a].
- An additional 22% of Australians have a long-term health condition but do not experience disability. This group represents about 5.5 million people.
- The remaining 60% of Australians have no reported disability or long-term health condition, equating to about 14.8 million people.
Severity of Disability by Age
The severity of disability varies significantly by age.
Nearly one-third (32%) of Australians with disabilities, about 1.4 million people, experience severe or profound disability.
This equates to 5.7% of the total population and highlights the significant support needs of this group.
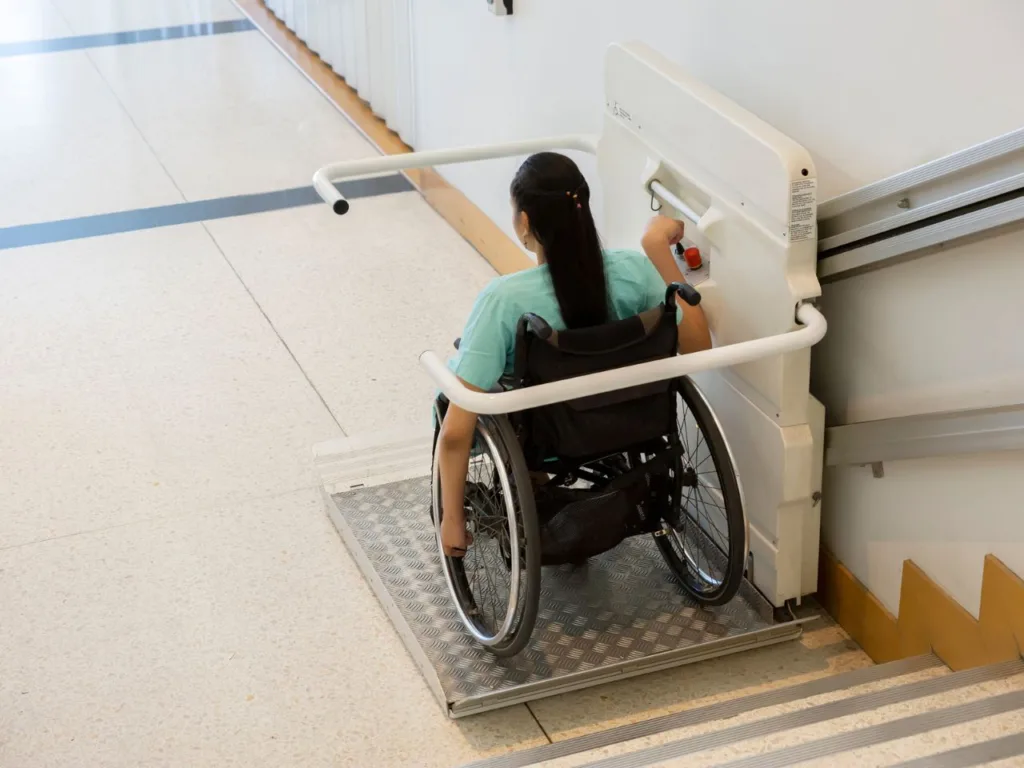
These individuals often require assistance with the following:
- Daily self-care activities: Tasks such as bathing, dressing, and eating.
- Mobility: Moving around the home and community.
- Communication: Understanding or being understood by others, including using sign language or other non-spoken methods.
Disability and Age
The likelihood of having a disability increases with age, a trend that underscores the ageing population’s growing needs:
- Young children (aged 0-4): 5.7% disability rate. Early intervention and support are crucial for this age group to ensure better long-term outcomes.
- Aged 90 and over: 83.1% disability rate. This high prevalence indicates the extensive care requirements among the oldest age groups.
- Aged 0-64: 15.0% disability rate. This demographic includes working-age individuals who may face unique employment and social participation challenges.
- Aged 65 and over: 52.3% disability rate, a significant increase from 49.6% in 2018. This translates to approximately 2.3 million people, reflecting the need for robust aged care and disability services.
Trends in Disability Prevalence
Understanding trends in disability prevalence helps in planning and resource allocation:
- Increase across age groups (under 70): All age groups below 70 years old saw an increase in disability prevalence, indicating a broader recognition and diagnosis of disabilities.
- Stable rates (over 70): The rate for people aged 70 and over remained relatively consistent, suggesting stable health conditions among the elderly.
- Significant increases in younger age groups:
- Children aged 0-4: The prevalence rate jumped from 3.7% to 5.7%, highlighting the need for early childhood disability services.
- People aged 15-24: The prevalence rate climbed from 9.3% to 13.9%, emphasising the importance of support during critical educational and early career stages.
Gender Differences
Gender differences in disability prevalence can indicate varying health and social support needs:
- Children aged 5-14: 16.4% of boys have a disability compared to 10.7% of girls.
- This disparity may be due to differences in the types and diagnosis rates of disabilities between genders.
Types of Disabilities in Australia
Physical Disabilities
Physical disabilities are the most common type of disability in Australia:
- Prevalence: In 2018, physical disorders affected over three-quarters (76.8%) of people with disabilities, consistent with 2015 data (78.5%).
- Physical disabilities can include conditions like arthritis, back problems, and mobility impairments.
Mental or Behavioral Disabilities
Mental and behavioural disorders are increasingly recognised as significant disabilities:
- Increasing prevalence: In 2018, nearly one-quarter (23.2%) reported mental or behavioural disorders as their main challenge, up from 21.5% in 2015.
- This increase reflects greater awareness and diagnosis of mental health conditions such as depression, anxiety, and behavioural disorders.
Sensory Impairments
Sensory impairments, including hearing and vision loss, significantly impact daily life:
- Hearing impairment: An estimated 3.6 million Australians experience hearing loss. The Hearing Services Program provided over 364,000 hearing devices in 2014-15, highlighting the widespread need for hearing support services.
- Vision impairment: Vision Australia estimates that 453,000 Australians have blindness or low vision, projected to increase to 564,000 by 2030. This excludes refractive errors and underscores the need for comprehensive vision care and support services.
Mental Health Conditions
Mental health conditions are highly prevalent and impact a significant portion of the population:
- Significant prevalence: Around 45% of Australians aged 16-85 experience a mental illness at some point in their life, with one in five adults experiencing a mental illness in any given year.
- This statistic emphasizes the critical need for accessible mental health services and support systems.
Trends in Disability Prevalence
Increasing Numbers
The overall number of people with disabilities in Australia has increased over time:
- Rising population: The number of people with disabilities has increased from about 4.0 million in 2003 to current estimates of approximately 4.4 million.
- This increase reflects both population growth and improved identification and reporting of disabilities.
Decreasing Prevalence Rate
Despite the increase in absolute numbers, the prevalence rate has decreased:
- Decreasing rate: The disability prevalence rate has reduced from 20.0% in 2003 to 17.7% in 2018.
- This trend suggests that while more people are living with disabilities, the overall population growth has outpaced this increase.
Disability and Long-Term Health Conditions
Prevalence
A significant portion of the adult population reports having a disability or long-term health condition:
- Around 6.8 million Australians (40%) aged 18 and over have a disability or long-term health condition according to reports.
- This statistic highlights the widespread chronic health issues within the adult population.
Impact on Daily Activities
Disabilities often limit the person’s ability to perform everyday activities:
- 87% of Australians with disabilities experience limitations in performing at least one everyday activity, such as self-care, mobility, or communication.
- This high percentage underscores the need for improvements in supportive services and accessibility.
Employment and Disability
Labour Force Participation
Employment is a critical area where people with disabilities face significant challenges:
- Steady participation rates: The participation rate for people with disabilities has remained around 53.4% since 2015, compared to 84.1% for those without disabilities. This gap indicates ongoing barriers to workforce entry and participation for people with disabilities.
- Higher rates outside the labour force: A significantly higher proportion of working-age people with disabilities are outside the labour force (46.6%) compared to those without a disability (15.9%). This statistic highlights the need for inclusive employment policies and practices.
Employment Rates
People with disabilities experience lower employment rates and job security:
- Employment gap: Nearly half (47.8%) of people with disabilities in the labour force are employed, compared to 80.3% of those without disabilities. This substantial gap reflects the challenges in securing and maintaining employment.
- Full-time employment: Only 28.3% of people with disabilities hold full-time jobs, compared to 54.8% of those without disabilities. This difference indicates a prevalence of part-time and casual work among people with disabilities.
Emerging Trends
There are positive trends in employment for some groups:
- Positive trend for women: More women with profound or severe disabilities are working full-time (9.2% in 2018 compared to 5.5% in 2015).
- This trend suggests improvements in workplace inclusivity and support for women with disabilities.
Employment Challenges
Despite some positive trends, many challenges remain:
- Barriers to employment: Many working-age people with disabilities face challenges securing and maintaining employment, reflected in lower labour force participation rates, lower employment rates, higher unemployment rates, and underemployment.
- Youth and underemployment: Young people with disabilities (aged 15-24) are more likely to be underemployed compared to older age groups (25-64). This underemployment indicates a need for targeted employment support and career development programs for young people with disabilities.
Financial Wellbeing of Australians with Disabilities
Financial Struggles
People with disabilities often face significant financial challenges:
- Higher financial struggle: In 2021, around 1 in 3 (32%) people with disabilities described their financial situation as “just getting along.”
- Nearly 1 in 12 (8%) said they were poor or very poor.
- These rates are significantly higher than for those without disabilities, highlighting the economic vulnerability of this group.
Age and Financial Security
Financial security generally improves with age, but disparities remain:
- Improvement with age: Financial security generally improves with age, but older people with disabilities still report more financial difficulties compared to their peers without disabilities.
- This suggests ongoing financial challenges even as people age.
Severity and Financial Hardship
The severity of disability affects financial well-being:
- Severe or profound disabilities: Over half (53%) of people with severe or profound disabilities described themselves as “just getting along” or poor/very poor.
- This statistic indicates a high level of financial hardship among those with the most severe disabilities.
Financial Satisfaction
People with disabilities report lower financial satisfaction:
- Lower satisfaction: People with disabilities are less satisfied with their financial situation than those without disabilities (33% unsatisfied vs. 14% in 2021).
- This dissatisfaction reflects broader economic challenges and barriers to financial stability.
Emergency Funds
Access to emergency funds is a significant issue:
- Difficulty raising funds: People with disabilities face greater challenges raising emergency funds within a short timeframe, with a quarter (25%) unable to raise $3,000 in a week.
- This difficulty highlights the need for improved financial support and savings programs for people with disabilities.
Vehicle Ownership among People with Disabilities
Access to Vehicles
Vehicle ownership is a critical aspect of independence:
- High access: In 2018, 92% of Australians with disabilities had access to a motor vehicle in their household.
- However, they were significantly less likely to own a car themselves compared to those without disabilities, indicating potential barriers to personal vehicle ownership.
Affordability Barriers
Affordability is a major barrier to vehicle ownership:
- Affordability as a significant barrier: Over 42% of working-age Australians with disabilities who lack a household vehicle cited affordability as the main reason.
- This barrier underscores the financial challenges that people with disabilities face in achieving independence and mobility.
Disability Discrimination in Australia
Prevalence of Discrimination
Discrimination remains a significant issue for people with disabilities:
- High rates: One in five (22%) working-age Australians with disabilities reported experiencing some form of discrimination in 12 months, higher than the rate for people without disabilities.
- This statistic highlights the pervasive nature of discrimination against people with disabilities.
Specific Disability Discrimination
Many people face discrimination precisely due to their disability:
- Significant discrimination: One in six (16%) reported experiencing discrimination precisely due to their disability.
- This figure emphasizes the need for stronger anti-discrimination policies and practices.
Avoiding Situations
Fear of discrimination leads to avoidance behaviours:
- Avoidance due to disability: A substantial number of people with disabilities avoid situations because of their disability, suggesting fear of potential discrimination or a perception of not being welcome.
- This avoidance can limit opportunities for social and economic participation.
Barriers to Accessibility
Accessibility issues contribute to discrimination:
- Accessibility issues: In 2018, three in ten (30%) people with mobility or communication challenges faced difficulties accessing buildings or facilities.
- Additionally, 16% had difficulty using public transport, further highlighting barriers to full participation in society.
Customers with Disabilities
Negative experiences in businesses affect people with disabilities:
- Negative experiences: Customers with disabilities are three times more likely to avoid a business and twice as likely to discourage others due to a poor reputation for disability inclusion.
- Additionally, 36% report being treated less favourably, and many face service gaps that don’t meet their needs.
Missed Opportunities
Businesses are missing opportunities to serve customers with disabilities:
- Business impact: Over a quarter (28%) of Australians with disabilities faced discrimination from recent businesses they interacted with.
- The majority of small and medium businesses haven’t taken proactive steps to improve accessibility, often citing a lack of customer requests.
Avoiding Businesses
Frequent avoidance of businesses is common among people with disabilities:
- Frequent avoidance: Nearly a third (33.1%) of Australians with disabilities avoid situations due to their disability, with frequent avoidance of essential businesses like shops and banks (34.3%).
- This avoidance indicates significant barriers to everyday activities and economic participation.
Sources:
https://melbourneinstitute.unimelb.edu.au/hilda
https://www.commbank.com.au/content/dam/commbank-assets/support/2021-09/unsw-disability-report-4.pdf
Department of Social Services (DSS) and Melbourne Institute: Applied, Economic and Social Research (MIAESR) (2022).
MORE FROM CENTRE DISABILITY SUPPORT